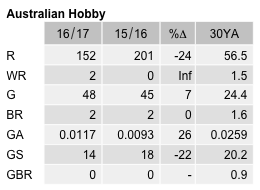
Australian Hobby
Falco longipennis
ABR description
The following is extracted from the Annual Bird Report for the twelve months to June 2017.
Common, breeding resident/summer migrant
A distinctive small raptor often observed when the next generation takes flight around February.
General: 160 records this year, but as usual the reporting rate of 1.1% is significantly down on the 30YA of 2.1%. Hobbies were recorded in 47 weeks, 19% in winter, 16% spring, summer 30% and autumn 35%. Range 1-5 birds, average 1.1, median 1. Max 5/8 Mar Hoskinstown GrR16 (BuM1). Recorded in 50 widespread but largely urban grid cells. There were 2 possible breeding records: on/9 Oct Karool GrL25 (CaR3); and di/24 Feb ANU (MiP1).
GBS: Only 28 records. The A value (0.0117) and the reporting rate (1.1%) are both down on the 30YA of A=0.0259 and 2.3%, respectively. Hobbies were recorded in 22 weeks but unlike the general records there were more winter records 25%, spring 18%, summer 21% and autumn 36%. Most records were of single birds, from 14 largely urban sites. No breeding recorded since 2012.
Abundance
Abundance is the average number of birds of that species per survey. Where the species was observed (presence recorded) but the number of birds seen was not recorded, this is treated as a count of zero.
Abundance by year
This chart shows the abundance of Australian Hobby between 1982 and 2017. 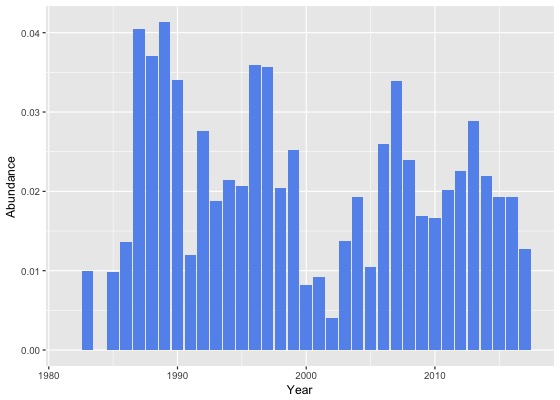
Abundance by month
This chart shows the monthly abundance of Australian Hobby. The blue lines show the abundance for the twelve months to June 2017 and the bars show the average abundance for the period 1982 to 2017. 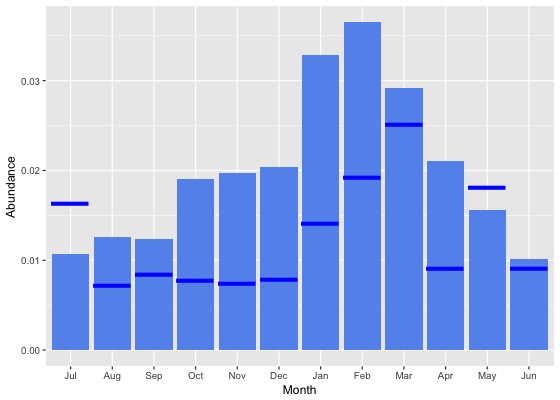
Abundance by season
This chart shows the seasonal abundance of Australian Hobby. The blue lines show the seasonal abundance for the twelve months to June 2017 and the bars show the average seasonal abundance for the period 1982 to 2017. 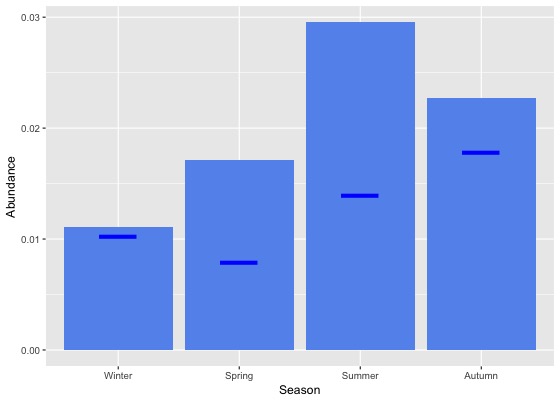
Abundance data
| Month | Season | ||||||||||||||||||
|---|---|---|---|---|---|---|---|---|---|---|---|---|---|---|---|---|---|---|---|
| Period | Jul | Aug | Sep | Oct | Nov | Dec | Jan | Feb | Mar | Apr | May | Jun | Winter | Spring | Summer | Autumn | All | ||
| All years | |||||||||||||||||||
| All | 0.0 | 0.0 | 0.0 | 0.0 | 0.0 | 0.0 | 0.0 | 0.0 | 0.0 | 0.0 | 0.0 | 0.0 | 0.0 | 0.0 | 0.0 | 0.0 | 0.0 | ||
| Previous years | |||||||||||||||||||
| All previous years | 0.0 | 0.0 | 0.0 | 0.0 | 0.0 | 0.0 | 0.0 | 0.0 | 0.0 | 0.0 | 0.0 | 0.0 | 0.0 | 0.0 | 0.0 | 0.0 | 0.0 | ||
| Previous 30 years | 0.0 | 0.0 | 0.0 | 0.0 | 0.0 | 0.0 | 0.0 | 0.0 | 0.0 | 0.0 | 0.0 | 0.0 | 0.0 | 0.0 | 0.0 | 0.0 | 0.0 | ||
| Previous 20 years | 0.0 | 0.0 | 0.0 | 0.0 | 0.0 | 0.0 | 0.0 | 0.0 | 0.0 | 0.0 | 0.0 | 0.0 | 0.0 | 0.0 | 0.0 | 0.0 | 0.0 | ||
| 10 year groups | |||||||||||||||||||
| [2007,2017) | 0.0 | 0.0 | 0.0 | 0.0 | 0.0 | 0.0 | 0.0 | 0.0 | 0.0 | 0.0 | 0.0 | 0.0 | 0.0 | 0.0 | 0.0 | 0.0 | 0.0 | ||
| [1997,2007) | 0.0 | 0.0 | 0.0 | 0.0 | 0.0 | 0.0 | 0.0 | 0.0 | 0.0 | 0.0 | 0.0 | 0.0 | 0.0 | 0.0 | 0.0 | 0.0 | 0.0 | ||
| [1987,1997) | 0.0 | 0.0 | 0.0 | 0.0 | 0.0 | 0.0 | 0.0 | 0.1 | 0.1 | 0.0 | 0.0 | 0.0 | 0.0 | 0.0 | 0.0 | 0.0 | 0.0 | ||
| 5 year groups | |||||||||||||||||||
| [2012,2017) | 0.0 | 0.0 | 0.0 | 0.0 | 0.0 | 0.0 | 0.0 | 0.0 | 0.0 | 0.0 | 0.0 | 0.0 | 0.0 | 0.0 | 0.0 | 0.0 | 0.0 | ||
| [2007,2012) | 0.0 | 0.0 | 0.0 | 0.0 | 0.0 | 0.0 | 0.1 | 0.0 | 0.0 | 0.0 | 0.0 | 0.0 | 0.0 | 0.0 | 0.0 | 0.0 | 0.0 | ||
| [2002,2007) | 0.0 | 0.0 | 0.0 | 0.0 | 0.0 | 0.0 | 0.0 | 0.0 | 0.0 | 0.0 | 0.0 | 0.0 | 0.0 | 0.0 | 0.0 | 0.0 | 0.0 | ||
| [1997,2002) | 0.0 | 0.0 | 0.0 | 0.0 | 0.0 | 0.0 | 0.0 | 0.0 | 0.0 | 0.0 | 0.0 | 0.0 | 0.0 | 0.0 | 0.0 | 0.0 | 0.0 | ||
| [1992,1997) | 0.0 | 0.0 | 0.0 | 0.0 | 0.0 | 0.0 | 0.0 | 0.0 | 0.0 | 0.0 | 0.0 | 0.0 | 0.0 | 0.0 | 0.0 | 0.0 | 0.0 | ||
| [1987,1992) | 0.0 | 0.0 | 0.0 | 0.0 | 0.0 | 0.0 | 0.1 | 0.1 | 0.1 | 0.0 | 0.0 | 0.0 | 0.0 | 0.0 | 0.1 | 0.0 | 0.0 | ||
| Year | |||||||||||||||||||
| 2017 | 0.0 | 0.0 | 0.0 | 0.0 | 0.0 | 0.0 | 0.0 | 0.0 | 0.0 | 0.0 | 0.0 | 0.0 | 0.0 | 0.0 | 0.0 | 0.0 | 0.0 | ||
| 2016 | 0.0 | 0.0 | 0.0 | 0.0 | 0.0 | 0.0 | 0.0 | 0.0 | 0.0 | 0.0 | 0.0 | 0.0 | 0.0 | 0.0 | 0.0 | 0.0 | 0.0 | ||
| 2015 | 0.0 | 0.0 | 0.0 | 0.0 | 0.0 | 0.0 | 0.0 | 0.0 | 0.0 | 0.0 | 0.0 | 0.0 | 0.0 | 0.0 | 0.0 | 0.0 | 0.0 | ||
| 2014 | 0.0 | 0.0 | 0.0 | 0.0 | 0.0 | 0.0 | 0.0 | 0.1 | 0.0 | 0.0 | 0.0 | 0.0 | 0.0 | 0.0 | 0.0 | 0.0 | 0.0 | ||
| 2013 | 0.0 | 0.0 | 0.0 | 0.0 | 0.0 | 0.0 | 0.1 | 0.1 | 0.0 | 0.0 | 0.0 | 0.0 | 0.0 | 0.0 | 0.0 | 0.0 | 0.0 | ||
| 2012 | 0.0 | 0.0 | 0.0 | 0.0 | 0.0 | 0.0 | 0.0 | 0.0 | 0.0 | 0.0 | 0.0 | 0.0 | 0.0 | 0.0 | 0.0 | 0.0 | 0.0 | ||
| 2011 | 0.0 | 0.0 | 0.0 | 0.0 | 0.0 | 0.0 | 0.0 | 0.0 | 0.0 | 0.0 | 0.0 | 0.0 | 0.0 | 0.0 | 0.0 | 0.0 | 0.0 | ||
| 2010 | 0.0 | 0.0 | 0.0 | 0.0 | 0.0 | 0.0 | 0.0 | 0.0 | 0.0 | 0.0 | 0.0 | 0.0 | 0.0 | 0.0 | 0.0 | 0.0 | 0.0 | ||
| 2009 | 0.0 | 0.0 | 0.0 | 0.0 | 0.0 | 0.0 | 0.0 | 0.1 | 0.0 | 0.0 | 0.0 | 0.0 | 0.0 | 0.0 | 0.0 | 0.0 | 0.0 | ||
| 2008 | 0.0 | 0.0 | 0.0 | 0.0 | 0.1 | 0.0 | 0.1 | 0.0 | 0.0 | 0.0 | 0.0 | 0.0 | 0.0 | 0.0 | 0.0 | 0.0 | 0.0 | ||
| 2007 | 0.0 | 0.0 | 0.0 | 0.0 | 0.1 | 0.0 | 0.1 | 0.1 | 0.0 | 0.0 | 0.0 | 0.0 | 0.0 | 0.0 | 0.1 | 0.0 | 0.0 | ||
| 2006 | 0.0 | 0.0 | 0.0 | 0.0 | 0.0 | 0.0 | 0.1 | 0.0 | 0.0 | 0.0 | 0.0 | 0.0 | 0.0 | 0.0 | 0.0 | 0.0 | 0.0 | ||
| 2005 | 0.0 | 0.0 | 0.0 | 0.0 | 0.0 | 0.0 | 0.0 | 0.0 | 0.0 | 0.0 | 0.0 | 0.0 | 0.0 | 0.0 | 0.0 | 0.0 | 0.0 | ||
| 2004 | 0.0 | 0.0 | 0.0 | 0.0 | 0.0 | 0.0 | 0.0 | 0.0 | 0.1 | 0.0 | 0.0 | 0.0 | 0.0 | 0.0 | 0.0 | 0.0 | 0.0 | ||
| 2003 | 0.0 | 0.0 | 0.0 | 0.0 | 0.0 | 0.0 | 0.0 | 0.0 | 0.0 | 0.0 | 0.0 | 0.0 | 0.0 | 0.0 | 0.0 | 0.0 | 0.0 | ||
| 2002 | 0.0 | 0.0 | 0.0 | 0.0 | 0.0 | 0.0 | 0.0 | 0.0 | 0.0 | 0.0 | 0.0 | 0.0 | 0.0 | 0.0 | 0.0 | 0.0 | 0.0 | ||
| 2001 | 0.0 | 0.0 | 0.0 | 0.0 | 0.0 | 0.0 | 0.0 | 0.0 | 0.0 | 0.0 | 0.0 | 0.0 | 0.0 | 0.0 | 0.0 | 0.0 | 0.0 | ||
| 2000 | 0.0 | 0.0 | 0.0 | 0.0 | 0.0 | 0.0 | 0.0 | 0.0 | 0.0 | 0.0 | 0.0 | 0.0 | 0.0 | 0.0 | 0.0 | 0.0 | 0.0 | ||
| 1999 | 0.0 | 0.0 | 0.0 | 0.1 | 0.0 | 0.0 | 0.0 | 0.0 | 0.1 | 0.0 | 0.0 | 0.0 | 0.0 | 0.0 | 0.0 | 0.0 | 0.0 | ||
| 1998 | 0.0 | 0.0 | 0.0 | 0.0 | 0.0 | 0.0 | 0.1 | 0.0 | 0.0 | 0.0 | 0.0 | 0.0 | 0.0 | 0.0 | 0.0 | 0.0 | 0.0 | ||
| 1997 | 0.0 | 0.1 | 0.0 | 0.0 | 0.0 | 0.0 | 0.1 | 0.0 | 0.2 | 0.0 | 0.0 | 0.0 | 0.0 | 0.0 | 0.0 | 0.1 | 0.0 | ||
| 1996 | 0.0 | 0.0 | 0.0 | 0.0 | 0.0 | 0.0 | 0.1 | 0.1 | 0.0 | 0.0 | 0.0 | 0.0 | 0.0 | 0.0 | 0.1 | 0.0 | 0.0 | ||
| 1995 | 0.0 | 0.0 | 0.0 | 0.0 | 0.0 | 0.0 | 0.0 | 0.0 | 0.1 | 0.0 | 0.0 | 0.0 | 0.0 | 0.0 | 0.0 | 0.0 | 0.0 | ||
| 1994 | 0.0 | 0.0 | 0.0 | 0.0 | 0.0 | 0.0 | 0.0 | 0.0 | 0.0 | 0.0 | 0.0 | 0.0 | 0.0 | 0.0 | 0.0 | 0.0 | 0.0 | ||
| 1993 | 0.0 | 0.0 | 0.0 | 0.0 | 0.0 | 0.0 | 0.0 | 0.0 | 0.0 | 0.0 | 0.0 | 0.0 | 0.0 | 0.0 | 0.0 | 0.0 | 0.0 | ||
| 1992 | 0.0 | 0.0 | 0.0 | 0.0 | 0.1 | 0.0 | 0.1 | 0.0 | 0.0 | 0.0 | 0.0 | 0.0 | 0.0 | 0.0 | 0.1 | 0.0 | 0.0 | ||
| 1991 | 0.0 | 0.0 | 0.0 | 0.0 | 0.0 | 0.0 | 0.0 | 0.0 | 0.0 | 0.0 | 0.0 | 0.0 | 0.0 | 0.0 | 0.0 | 0.0 | 0.0 | ||
| 1990 | 0.0 | 0.0 | 0.0 | 0.0 | 0.1 | 0.0 | 0.0 | 0.1 | 0.0 | 0.0 | 0.0 | 0.0 | 0.0 | 0.0 | 0.0 | 0.0 | 0.0 | ||
| 1989 | 0.0 | 0.0 | 0.0 | 0.0 | 0.1 | 0.0 | 0.0 | 0.1 | 0.0 | 0.1 | 0.0 | 0.0 | 0.0 | 0.0 | 0.1 | 0.0 | 0.0 | ||
| 1988 | 0.0 | 0.0 | 0.0 | 0.0 | 0.0 | 0.0 | 0.1 | 0.1 | 0.1 | 0.1 | 0.0 | 0.0 | 0.0 | 0.0 | 0.1 | 0.0 | 0.0 | ||
| 1987 | 0.0 | 0.0 | 0.0 | 0.0 | 0.0 | 0.0 | 0.1 | 0.1 | 0.1 | 0.0 | 0.0 | 0.0 | 0.0 | 0.0 | 0.1 | 0.0 | 0.0 | ||
| 1986 | 0.0 | 0.0 | 0.0 | 0.0 | 0.0 | 0.0 | 0.0 | 0.1 | 0.0 | 0.0 | 0.0 | 0.0 | 0.0 | 0.0 | 0.0 | 0.0 | 0.0 | ||
| 1985 | 0.0 | 0.0 | 0.0 | 0.0 | 0.0 | 0.0 | 0.1 | 0.1 | 0.0 | 0.1 | 0.0 | 0.0 | 0.0 | 0.0 | 0.0 | 0.0 | 0.0 | ||
| 1984 | 0.0 | 0.0 | 0.0 | 0.0 | 0.0 | 0.0 | 0.0 | 0.0 | 0.0 | 0.0 | 0.0 | 0.0 | 0.0 | 0.0 | 0.0 | 0.0 | 0.0 | ||
| 1983 | 0.0 | 0.0 | 0.0 | 0.0 | 0.0 | 0.1 | 0.0 | 0.0 | 0.0 | - | 0.0 | 0.0 | 0.0 | 0.0 | 0.0 | 0.0 | 0.0 | ||
| 1982 | - | 0.0 | - | 0.0 | 0.0 | 0.0 | - | 0.0 | - | 0.0 | - | 0.0 | 0.0 | 0.0 | 0.0 | 0.0 | 0.0 | ||
Reporting rates
Reporting rate is the proportion of all surveys in which the species was present.
Reporting rate by year
This chart shows the reporting rate of Australian Hobby each year between 1982 and 2017. 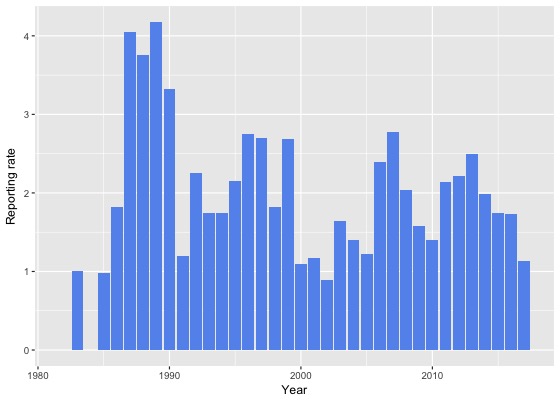
Reporting rate by month
This chart shows the reporting rate by month of Australian Hobby. The blue lines show the reporting rate for the twelve months to June 2017 and the bars show the average reporting rate for the period 1982 to 2017. 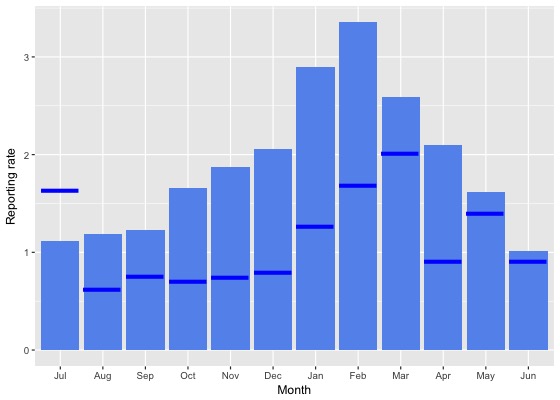
Reporting rate by season
This chart shows the seasonal reporting rate of Australian Hobby. The blue lines show the seasonal reporting rate for the twelve months to June 2017 and the bars show the average seasonal reporting rate for the period 1982 to 2017. 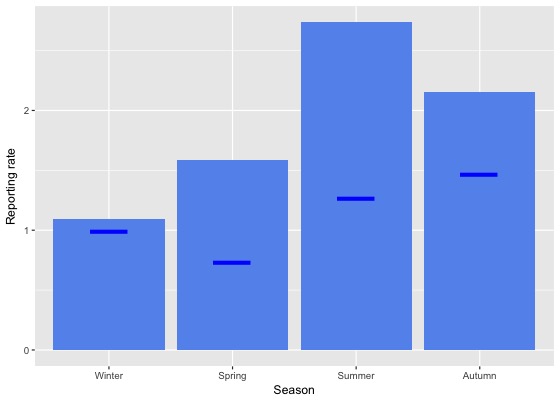
Reporting rate data
| Month | Season | ||||||||||||||||||
|---|---|---|---|---|---|---|---|---|---|---|---|---|---|---|---|---|---|---|---|
| Period | Jul | Aug | Sep | Oct | Nov | Dec | Jan | Feb | Mar | Apr | May | Jun | Winter | Spring | Summer | Autumn | All | ||
| All years | |||||||||||||||||||
| All | 1.1 | 1.2 | 1.2 | 1.7 | 1.9 | 2.1 | 2.9 | 3.4 | 2.6 | 2.1 | 1.6 | 1.0 | 1.1 | 1.6 | 2.7 | 2.2 | 1.9 | ||
| Previous years | |||||||||||||||||||
| All previous years | 1.0 | 1.3 | 1.3 | 1.8 | 2.0 | 2.2 | 3.2 | 3.7 | 2.7 | 2.3 | 1.7 | 1.0 | 1.1 | 1.7 | 3.0 | 2.3 | 2.1 | ||
| Previous 30 years | 1.0 | 1.3 | 1.3 | 1.8 | 2.1 | 2.2 | 3.2 | 3.7 | 2.7 | 2.3 | 1.7 | 1.1 | 1.1 | 1.7 | 3.0 | 2.3 | 2.1 | ||
| Previous 20 years | 0.9 | 1.2 | 1.1 | 1.6 | 1.7 | 2.2 | 3.0 | 3.0 | 2.3 | 2.0 | 1.8 | 0.9 | 1.0 | 1.5 | 2.7 | 2.0 | 1.8 | ||
| 10 year groups | |||||||||||||||||||
| [2007,2017) | 1.0 | 1.3 | 1.1 | 1.6 | 1.8 | 2.3 | 3.1 | 3.2 | 2.3 | 2.0 | 2.2 | 1.0 | 1.1 | 1.5 | 2.9 | 2.2 | 2.0 | ||
| [1997,2007) | 0.8 | 0.9 | 1.1 | 1.8 | 1.5 | 2.0 | 2.5 | 2.6 | 2.2 | 2.0 | 0.8 | 0.7 | 0.8 | 1.5 | 2.3 | 1.8 | 1.6 | ||
| [1987,1997) | 1.4 | 1.8 | 2.4 | 2.7 | 3.4 | 2.7 | 4.5 | 6.8 | 5.2 | 3.7 | 1.5 | 1.7 | 1.7 | 2.8 | 4.6 | 3.5 | 3.1 | ||
| 5 year groups | |||||||||||||||||||
| [2012,2017) | 1.1 | 1.4 | 1.0 | 1.5 | 1.4 | 1.9 | 2.7 | 3.0 | 2.6 | 2.3 | 2.4 | 1.3 | 1.3 | 1.3 | 2.6 | 2.4 | 1.9 | ||
| [2007,2012) | 0.8 | 1.1 | 1.4 | 1.8 | 2.7 | 3.0 | 4.7 | 4.0 | 1.6 | 1.3 | 1.6 | 0.5 | 0.7 | 1.8 | 3.8 | 1.5 | 2.0 | ||
| [2002,2007) | 0.8 | 0.6 | 0.8 | 1.8 | 1.0 | 2.1 | 3.0 | 2.6 | 2.4 | 1.5 | 0.8 | 0.7 | 0.7 | 1.2 | 2.5 | 1.7 | 1.5 | ||
| [1997,2002) | 0.8 | 1.1 | 1.5 | 1.8 | 2.2 | 1.8 | 2.0 | 2.6 | 1.9 | 2.6 | 0.8 | 0.7 | 0.8 | 1.8 | 2.1 | 1.9 | 1.7 | ||
| [1992,1997) | 0.6 | 1.2 | 1.8 | 2.6 | 2.2 | 2.1 | 3.1 | 2.5 | 3.9 | 2.1 | 1.6 | 1.8 | 1.2 | 2.3 | 2.6 | 2.6 | 2.2 | ||
| [1987,1992) | 1.8 | 2.1 | 2.6 | 2.8 | 3.9 | 2.9 | 5.4 | 8.5 | 6.1 | 4.7 | 1.4 | 1.7 | 1.9 | 3.1 | 5.5 | 4.1 | 3.6 | ||
| Year | |||||||||||||||||||
| 2017 | 1.6 | 0.6 | 0.8 | 0.7 | 0.7 | 0.8 | 1.3 | 1.7 | 2.0 | 0.9 | 1.4 | 0.9 | 1.0 | 0.7 | 1.3 | 1.5 | 1.1 | ||
| 2016 | 0.8 | 1.3 | 0.8 | 1.9 | 1.3 | 0.6 | 2.2 | 1.9 | 2.5 | 2.5 | 2.6 | 1.2 | 1.1 | 1.4 | 1.6 | 2.5 | 1.7 | ||
| 2015 | 0.9 | 1.1 | 0.7 | 1.1 | 1.5 | 2.1 | 2.1 | 2.4 | 2.5 | 1.9 | 2.8 | 1.5 | 1.2 | 1.1 | 2.2 | 2.4 | 1.7 | ||
| 2014 | 1.2 | 1.7 | 1.3 | 1.6 | 0.4 | 1.4 | 2.3 | 4.6 | 2.6 | 2.3 | 1.5 | 1.3 | 1.4 | 1.2 | 2.8 | 2.2 | 2.0 | ||
| 2013 | 0.9 | 1.4 | 1.4 | 2.2 | 1.3 | 2.6 | 4.4 | 4.7 | 2.6 | 3.5 | 1.7 | 1.1 | 1.1 | 1.7 | 3.7 | 2.7 | 2.5 | ||
| 2012 | 2.0 | 1.6 | 1.2 | 0.7 | 2.5 | 4.0 | 3.7 | 5.4 | 3.0 | 1.1 | 2.1 | 1.5 | 1.7 | 1.2 | 4.1 | 2.0 | 2.2 | ||
| 2011 | 0.0 | 0.8 | 1.2 | 1.6 | 1.2 | 3.9 | 4.7 | 5.5 | 1.6 | 0.9 | 1.5 | 1.2 | 0.8 | 1.4 | 4.6 | 1.3 | 2.1 | ||
| 2010 | 2.1 | 0.0 | 1.5 | 1.5 | 1.0 | 3.3 | 2.9 | 0.0 | 1.2 | 1.3 | 0.0 | 0.0 | 0.4 | 1.4 | 2.6 | 1.0 | 1.4 | ||
| 2009 | 0.7 | 1.0 | 1.9 | 1.1 | 0.4 | 1.1 | 2.7 | 5.8 | 2.3 | 1.2 | 3.1 | 0.5 | 0.7 | 1.2 | 2.8 | 2.0 | 1.6 | ||
| 2008 | 0.0 | 0.9 | 1.9 | 2.6 | 4.0 | 2.7 | 8.7 | 0.9 | 0.5 | 0.9 | 1.8 | 0.5 | 0.4 | 2.6 | 3.9 | 1.0 | 2.0 | ||
| 2007 | 2.2 | 2.8 | 0.4 | 2.0 | 8.8 | 3.4 | 5.5 | 5.2 | 2.1 | 2.6 | 1.6 | 0.3 | 1.2 | 2.8 | 4.5 | 2.2 | 2.8 | ||
| 2006 | 1.3 | 1.0 | 0.9 | 3.3 | 1.2 | 2.8 | 5.1 | 3.0 | 3.5 | 2.2 | 0.7 | 1.5 | 1.4 | 2.2 | 3.7 | 2.6 | 2.4 | ||
| 2005 | 1.5 | 1.9 | 1.5 | 1.1 | 2.1 | 1.6 | 0.7 | 4.3 | 0.4 | 0.0 | 0.5 | 1.1 | 1.4 | 1.5 | 1.9 | 0.3 | 1.2 | ||
| 2004 | 0.8 | 0.0 | 1.0 | 1.2 | 0.6 | 0.9 | 2.4 | 1.0 | 4.7 | 2.2 | 1.9 | 0.0 | 0.4 | 0.9 | 1.5 | 3.1 | 1.4 | ||
| 2003 | 0.9 | 0.7 | 0.0 | 1.0 | 0.5 | 3.8 | 3.7 | 3.3 | 2.2 | 2.3 | 0.8 | 0.0 | 0.5 | 0.5 | 3.6 | 1.9 | 1.6 | ||
| 2002 | 0.0 | 0.0 | 0.5 | 0.9 | 1.0 | 1.8 | 2.5 | 1.3 | 0.9 | 0.6 | 0.0 | 0.0 | 0.0 | 0.8 | 1.8 | 0.6 | 0.9 | ||
| 2001 | 1.3 | 0.6 | 0.6 | 0.8 | 2.8 | 2.9 | 1.5 | 2.6 | 0.0 | 1.0 | 0.6 | 0.0 | 0.7 | 1.2 | 2.4 | 0.4 | 1.2 | ||
| 2000 | 0.8 | 0.0 | 1.4 | 0.9 | 1.9 | 0.3 | 0.4 | 2.4 | 1.2 | 2.7 | 0.0 | 0.5 | 0.4 | 1.4 | 0.9 | 1.5 | 1.1 | ||
| 1999 | 0.0 | 2.1 | 1.1 | 4.4 | 3.2 | 3.1 | 1.5 | 2.9 | 4.9 | 3.6 | 1.1 | 1.9 | 1.7 | 2.9 | 2.5 | 3.2 | 2.7 | ||
| 1998 | 0.0 | 0.0 | 4.1 | 3.3 | 0.9 | 0.0 | 5.9 | 3.8 | 1.1 | 0.0 | 0.0 | 0.0 | 0.0 | 2.7 | 2.6 | 0.6 | 1.8 | ||
| 1997 | 0.0 | 5.2 | 1.8 | 0.0 | 1.7 | 2.9 | 7.8 | 1.8 | 10.0 | 4.6 | 2.2 | 0.0 | 1.4 | 1.3 | 3.8 | 5.2 | 2.7 | ||
| 1996 | 0.0 | 2.1 | 1.3 | 3.5 | 1.9 | 1.0 | 4.9 | 4.7 | 3.9 | 3.1 | 0.0 | 4.6 | 2.4 | 2.4 | 3.5 | 2.7 | 2.7 | ||
| 1995 | 0.0 | 0.0 | 1.9 | 3.0 | 0.9 | 3.4 | 1.8 | 1.6 | 7.1 | 2.4 | 2.6 | 1.1 | 0.3 | 2.1 | 2.3 | 4.0 | 2.2 | ||
| 1994 | 2.0 | 3.9 | 1.5 | 2.3 | 2.2 | 0.0 | 1.5 | 1.7 | 2.3 | 0.8 | 1.2 | 1.1 | 2.3 | 2.1 | 1.2 | 1.3 | 1.7 | ||
| 1993 | 0.0 | 0.0 | 1.6 | 4.0 | 3.0 | 4.3 | 0.0 | 0.0 | 2.5 | 1.7 | 2.6 | 0.0 | 0.0 | 3.0 | 1.6 | 2.3 | 1.7 | ||
| 1992 | 1.5 | 0.0 | 2.4 | 0.0 | 4.2 | 1.6 | 6.9 | 2.4 | 2.8 | 3.4 | 1.3 | 1.7 | 1.1 | 2.0 | 3.7 | 2.4 | 2.3 | ||
| 1991 | 0.8 | 0.0 | 2.3 | 0.0 | 1.0 | 0.0 | 1.8 | 2.0 | 3.2 | 1.7 | 3.3 | 0.0 | 0.4 | 1.0 | 1.1 | 2.7 | 1.2 | ||
| 1990 | 1.9 | 3.2 | 4.3 | 2.0 | 5.6 | 2.8 | 1.4 | 8.5 | 3.4 | 4.8 | 1.4 | 1.3 | 2.4 | 4.0 | 4.2 | 3.3 | 3.3 | ||
| 1989 | 3.1 | 3.4 | 0.9 | 4.2 | 6.1 | 3.0 | 4.3 | 9.3 | 5.6 | 5.6 | 2.0 | 3.0 | 3.2 | 3.6 | 5.4 | 4.6 | 4.2 | ||
| 1988 | 1.3 | 1.1 | 1.1 | 2.3 | 3.5 | 2.1 | 7.0 | 12.0 | 6.9 | 5.9 | 2.0 | 2.4 | 1.6 | 2.5 | 6.9 | 4.9 | 3.8 | ||
| 1987 | 0.0 | 0.0 | 4.9 | 3.1 | 3.3 | 4.7 | 7.2 | 6.7 | 7.7 | 3.7 | 0.0 | 0.5 | 0.4 | 3.7 | 6.2 | 3.7 | 4.1 | ||
| 1986 | 0.0 | 0.0 | 0.0 | 0.0 | 2.1 | 5.9 | 0.0 | 8.3 | 0.0 | 3.9 | 0.0 | 0.0 | 0.0 | 0.7 | 5.4 | 1.8 | 1.8 | ||
| 1985 | 0.0 | 0.0 | 0.0 | 1.2 | 0.0 | 0.0 | 12.5 | 5.9 | 0.0 | 5.3 | 0.0 | 0.0 | 0.0 | 0.5 | 2.4 | 2.5 | 1.0 | ||
| 1984 | 0.0 | 0.0 | 0.0 | 0.0 | 0.0 | 0.0 | 0.0 | 0.0 | 0.0 | 0.0 | 0.0 | 0.0 | 0.0 | 0.0 | 0.0 | 0.0 | 0.0 | ||
| 1983 | 0.0 | 0.0 | 0.0 | 0.0 | 0.0 | 7.7 | 0.0 | 0.0 | 0.0 | - | 0.0 | 0.0 | 0.0 | 0.0 | 3.3 | 0.0 | 1.0 | ||
| 1982 | - | 0.0 | - | 0.0 | 0.0 | 0.0 | - | 0.0 | - | 0.0 | - | 0.0 | 0.0 | 0.0 | 0.0 | 0.0 | 0.0 | ||
Breeding data
Breeding records by month
Number of breeding records by breeding code and month, 2017 and all years| Breeding code | Jul | Aug | Sep | Oct | Nov | Dec | Jan | Feb | Mar | Apr | May | Jun |
|---|---|---|---|---|---|---|---|---|---|---|---|---|
| 2017 | ||||||||||||
| Breeding (BLA code) | 0 | 0 | 0 | 0 | 0 | 0 | 0 | 0 | 0 | 0 | 0 | 0 |
| Carrying Food | 0 | 0 | 0 | 0 | 0 | 0 | 0 | 0 | 0 | 0 | 0 | 0 |
| Copulating | 0 | 0 | 0 | 0 | 0 | 0 | 0 | 0 | 0 | 0 | 0 | 0 |
| Display | 0 | 0 | 0 | 0 | 0 | 0 | 0 | 1 | 0 | 0 | 0 | 0 |
| Dependent young | 0 | 0 | 0 | 0 | 0 | 0 | 0 | 0 | 0 | 0 | 0 | 0 |
| Faecal sac | 0 | 0 | 0 | 0 | 0 | 0 | 0 | 0 | 0 | 0 | 0 | 0 |
| Inspecting hollow | 0 | 0 | 0 | 0 | 0 | 0 | 0 | 0 | 0 | 0 | 0 | 0 |
| Nest building | 0 | 0 | 0 | 0 | 0 | 0 | 0 | 0 | 0 | 0 | 0 | 0 |
| Nest with eggs | 0 | 0 | 0 | 0 | 0 | 0 | 0 | 0 | 0 | 0 | 0 | 0 |
| Nest with young | 0 | 0 | 0 | 0 | 0 | 0 | 0 | 0 | 0 | 0 | 0 | 0 |
| On/leaving nest | 0 | 0 | 0 | 1 | 0 | 0 | 0 | 0 | 0 | 0 | 0 | 0 |
| All years | ||||||||||||
| Breeding (BLA code) | 0 | 0 | 1 | 0 | 0 | 1 | 3 | 0 | 0 | 0 | 0 | 0 |
| Carrying Food | 0 | 1 | 0 | 2 | 0 | 0 | 0 | 0 | 0 | 0 | 0 | 0 |
| Copulating | 0 | 0 | 0 | 0 | 0 | 0 | 0 | 0 | 0 | 0 | 0 | 0 |
| Display | 0 | 0 | 0 | 0 | 1 | 0 | 0 | 1 | 0 | 0 | 0 | 0 |
| Dependent young | 0 | 0 | 0 | 1 | 0 | 0 | 4 | 5 | 1 | 0 | 0 | 0 |
| Faecal sac | 0 | 0 | 0 | 0 | 0 | 0 | 0 | 0 | 0 | 0 | 0 | 0 |
| Inspecting hollow | 0 | 0 | 0 | 0 | 0 | 0 | 0 | 0 | 0 | 0 | 0 | 0 |
| Nest building | 0 | 0 | 0 | 2 | 0 | 0 | 0 | 0 | 0 | 0 | 0 | 0 |
| Nest with eggs | 0 | 0 | 0 | 0 | 0 | 0 | 0 | 0 | 0 | 0 | 0 | 0 |
| Nest with young | 0 | 0 | 0 | 0 | 1 | 1 | 1 | 1 | 0 | 0 | 0 | 0 |
| On/leaving nest | 0 | 0 | 1 | 14 | 1 | 3 | 0 | 5 | 0 | 0 | 0 | 0 |
Breeding records by year
Average number of breeding records per period by breeding code| Period | Breeding (BLA code) | Carrying Food | Copulating | Display | Dependent young | Faecal sac | Inspecting hollow | Nest building | Nest with eggs | Nest with young | On/leaving nest |
|---|---|---|---|---|---|---|---|---|---|---|---|
| All years | |||||||||||
| All | 0.1 | 0.1 | 0.0 | 0.1 | 0.3 | 0.0 | 0.0 | 0.1 | 0.0 | 0.1 | 0.7 |
| Previous years | |||||||||||
| All previous years | 0.1 | 0.1 | 0.0 | 0.0 | 0.3 | 0.0 | 0.0 | 0.1 | 0.0 | 0.1 | 0.7 |
| Previous 30 years | 0.2 | 0.1 | 0.0 | 0.0 | 0.4 | 0.0 | 0.0 | 0.1 | 0.0 | 0.1 | 0.8 |
| Previous 20 years | 0.2 | 0.1 | 0.0 | 0.0 | 0.5 | 0.0 | 0.0 | 0.0 | 0.0 | 0.0 | 1.1 |
| 10 year groups | |||||||||||
| [2007,2017) | 0.4 | 0.3 | 0.0 | 0.1 | 0.7 | 0.0 | 0.0 | 0.1 | 0.0 | 0.0 | 1.3 |
| [1997,2007) | 0.1 | 0.0 | 0.0 | 0.0 | 0.3 | 0.0 | 0.0 | 0.0 | 0.0 | 0.1 | 0.9 |
| [1987,1997) | 0.0 | 0.0 | 0.0 | 0.0 | 0.1 | 0.0 | 0.0 | 0.1 | 0.0 | 0.3 | 0.1 |
| 5 year groups | |||||||||||
| [2012,2017) | 0.4 | 0.6 | 0.0 | 0.2 | 0.6 | 0.0 | 0.0 | 0.0 | 0.0 | 0.0 | 1.0 |
| [2007,2012) | 0.4 | 0.0 | 0.0 | 0.0 | 0.8 | 0.0 | 0.0 | 0.2 | 0.0 | 0.0 | 1.6 |
| [2002,2007) | 0.0 | 0.0 | 0.0 | 0.0 | 0.4 | 0.0 | 0.0 | 0.0 | 0.0 | 0.2 | 0.4 |
| [1997,2002) | 0.2 | 0.0 | 0.0 | 0.0 | 0.2 | 0.0 | 0.0 | 0.0 | 0.0 | 0.0 | 1.4 |
| [1992,1997) | 0.0 | 0.0 | 0.0 | 0.0 | 0.0 | 0.0 | 0.0 | 0.0 | 0.0 | 0.4 | 0.2 |
| [1987,1992) | 0.0 | 0.0 | 0.0 | 0.0 | 0.2 | 0.0 | 0.0 | 0.2 | 0.0 | 0.2 | 0.0 |
| Year | |||||||||||
| 2017 | 0.0 | 0.0 | 0.0 | 1.0 | 0.0 | 0.0 | 0.0 | 0.0 | 0.0 | 0.0 | 1.0 |
| 2016 | 0.0 | 2.0 | 0.0 | 0.0 | 0.0 | 0.0 | 0.0 | 0.0 | 0.0 | 0.0 | 0.0 |
| 2015 | 0.0 | 0.0 | 0.0 | 1.0 | 0.0 | 0.0 | 0.0 | 0.0 | 0.0 | 0.0 | 0.0 |
| 2014 | 0.0 | 1.0 | 0.0 | 0.0 | 2.0 | 0.0 | 0.0 | 0.0 | 0.0 | 0.0 | 1.0 |
| 2013 | 0.0 | 0.0 | 0.0 | 0.0 | 1.0 | 0.0 | 0.0 | 0.0 | 0.0 | 0.0 | 4.0 |
| 2012 | 2.0 | 0.0 | 0.0 | 0.0 | 0.0 | 0.0 | 0.0 | 0.0 | 0.0 | 0.0 | 0.0 |
| 2011 | 0.0 | 0.0 | 0.0 | 0.0 | 1.0 | 0.0 | 0.0 | 0.0 | 0.0 | 0.0 | 1.0 |
| 2010 | 0.0 | 0.0 | 0.0 | 0.0 | 0.0 | 0.0 | 0.0 | 1.0 | 0.0 | 0.0 | 1.0 |
| 2009 | 0.0 | 0.0 | 0.0 | 0.0 | 1.0 | 0.0 | 0.0 | 0.0 | 0.0 | 0.0 | 2.0 |
| 2008 | 1.0 | 0.0 | 0.0 | 0.0 | 0.0 | 0.0 | 0.0 | 0.0 | 0.0 | 0.0 | 4.0 |
| 2007 | 1.0 | 0.0 | 0.0 | 0.0 | 2.0 | 0.0 | 0.0 | 0.0 | 0.0 | 0.0 | 0.0 |
| 2006 | 0.0 | 0.0 | 0.0 | 0.0 | 0.0 | 0.0 | 0.0 | 0.0 | 0.0 | 0.0 | 1.0 |
| 2005 | 0.0 | 0.0 | 0.0 | 0.0 | 0.0 | 0.0 | 0.0 | 0.0 | 0.0 | 0.0 | 1.0 |
| 2004 | 0.0 | 0.0 | 0.0 | 0.0 | 1.0 | 0.0 | 0.0 | 0.0 | 0.0 | 1.0 | 0.0 |
| 2003 | 0.0 | 0.0 | 0.0 | 0.0 | 1.0 | 0.0 | 0.0 | 0.0 | 0.0 | 0.0 | 0.0 |
| 2002 | 0.0 | 0.0 | 0.0 | 0.0 | 0.0 | 0.0 | 0.0 | 0.0 | 0.0 | 0.0 | 0.0 |
| 2001 | 0.0 | 0.0 | 0.0 | 0.0 | 0.0 | 0.0 | 0.0 | 0.0 | 0.0 | 0.0 | 0.0 |
| 2000 | 1.0 | 0.0 | 0.0 | 0.0 | 0.0 | 0.0 | 0.0 | 0.0 | 0.0 | 0.0 | 1.0 |
| 1999 | 0.0 | 0.0 | 0.0 | 0.0 | 1.0 | 0.0 | 0.0 | 0.0 | 0.0 | 0.0 | 6.0 |
| 1998 | 0.0 | 0.0 | 0.0 | 0.0 | 0.0 | 0.0 | 0.0 | 0.0 | 0.0 | 0.0 | 0.0 |
| 1997 | 0.0 | 0.0 | 0.0 | 0.0 | 0.0 | 0.0 | 0.0 | 0.0 | 0.0 | 0.0 | 0.0 |
| 1996 | 0.0 | 0.0 | 0.0 | 0.0 | 0.0 | 0.0 | 0.0 | 0.0 | 0.0 | 0.0 | 0.0 |
| 1995 | 0.0 | 0.0 | 0.0 | 0.0 | 0.0 | 0.0 | 0.0 | 0.0 | 0.0 | 0.0 | 0.0 |
| 1994 | 0.0 | 0.0 | 0.0 | 0.0 | 0.0 | 0.0 | 0.0 | 0.0 | 0.0 | 1.0 | 1.0 |
| 1993 | 0.0 | 0.0 | 0.0 | 0.0 | 0.0 | 0.0 | 0.0 | 0.0 | 0.0 | 0.0 | 0.0 |
| 1992 | 0.0 | 0.0 | 0.0 | 0.0 | 0.0 | 0.0 | 0.0 | 0.0 | 0.0 | 1.0 | 0.0 |
| 1991 | 0.0 | 0.0 | 0.0 | 0.0 | 0.0 | 0.0 | 0.0 | 0.0 | 0.0 | 0.0 | 0.0 |
| 1990 | 0.0 | 0.0 | 0.0 | 0.0 | 0.0 | 0.0 | 0.0 | 0.0 | 0.0 | 0.0 | 0.0 |
| 1989 | 0.0 | 0.0 | 0.0 | 0.0 | 0.0 | 0.0 | 0.0 | 1.0 | 0.0 | 0.0 | 0.0 |
| 1988 | 0.0 | 0.0 | 0.0 | 0.0 | 1.0 | 0.0 | 0.0 | 0.0 | 0.0 | 1.0 | 0.0 |
| 1987 | 0.0 | 0.0 | 0.0 | 0.0 | 0.0 | 0.0 | 0.0 | 0.0 | 0.0 | 0.0 | 0.0 |
| 1986 | 0.0 | 0.0 | 0.0 | 0.0 | 0.0 | 0.0 | 0.0 | 0.0 | 0.0 | 0.0 | 0.0 |
| 1985 | 0.0 | 0.0 | 0.0 | 0.0 | 0.0 | 0.0 | 0.0 | 0.0 | 0.0 | 0.0 | 0.0 |
| 1984 | 0.0 | 0.0 | 0.0 | 0.0 | 0.0 | 0.0 | 0.0 | 0.0 | 0.0 | 0.0 | 0.0 |
| 1983 | 0.0 | 0.0 | 0.0 | 0.0 | 0.0 | 0.0 | 0.0 | 0.0 | 0.0 | 0.0 | 0.0 |
| 1982 | 0.0 | 0.0 | 0.0 | 0.0 | 0.0 | 0.0 | 0.0 | 0.0 | 0.0 | 0.0 | 0.0 |
Distribution map
Distribution - 2017
This map shows the observed distribution of the Australian Hobby for 2017.
The red circles are the grid cells where Australian Hobby have been reported.
The transparency of the red circles indicate how many surveys sheets were submitted for that grid cell; the darker the red the more reliable the data. Of the 315 grid cells with reports, 83 had only one sheet; an example is grid number A11.
The size of the circle represents the reporting rate. The maximum reporting rate for Australian Hobby was 50.0% (eg grid number G9) and the minimum was 0.1% (eg grid number J14). 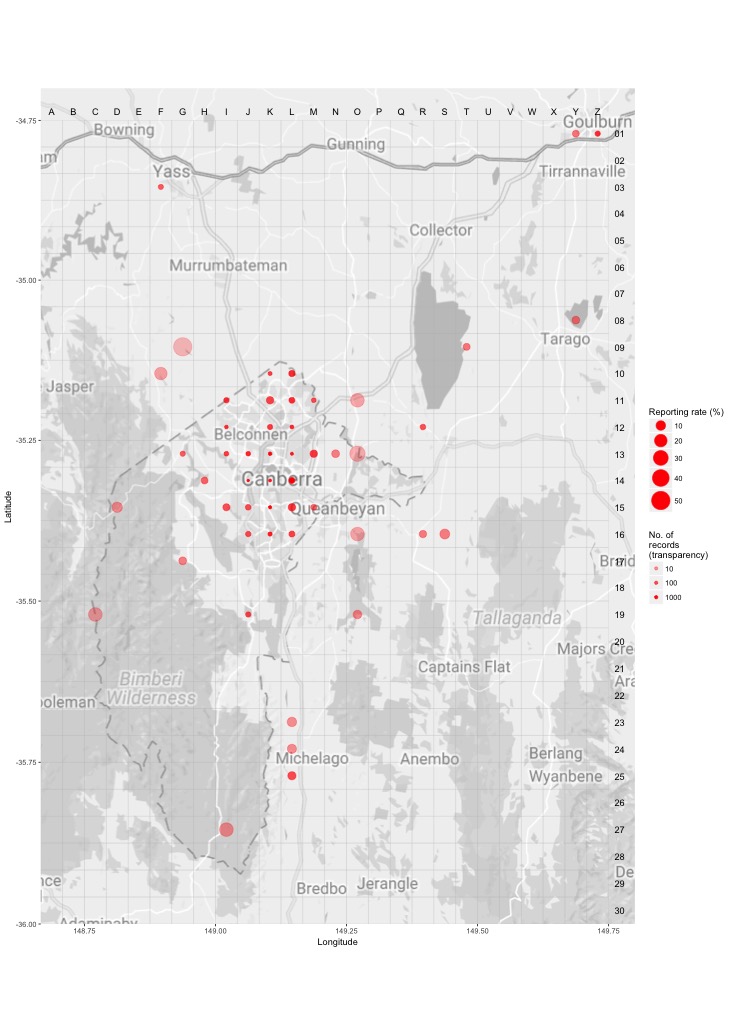
Distribution - all years
This map shows the observed distribution of the Australian Hobby for all years.
The red circles are the grid cells where Australian Hobby have been reported.
The transparency of the red circles indicate how many surveys sheets were submitted for that grid cell; the darker the red the more reliable the data. Of the 703 grid cells with reports, 55 had only one sheet; an example is grid number V15.
The size of the circle represents the reporting rate. The maximum reporting rate for Australian Hobby was 100.0% (eg grid number V15) and the minimum was 0.3% (eg grid number J18). 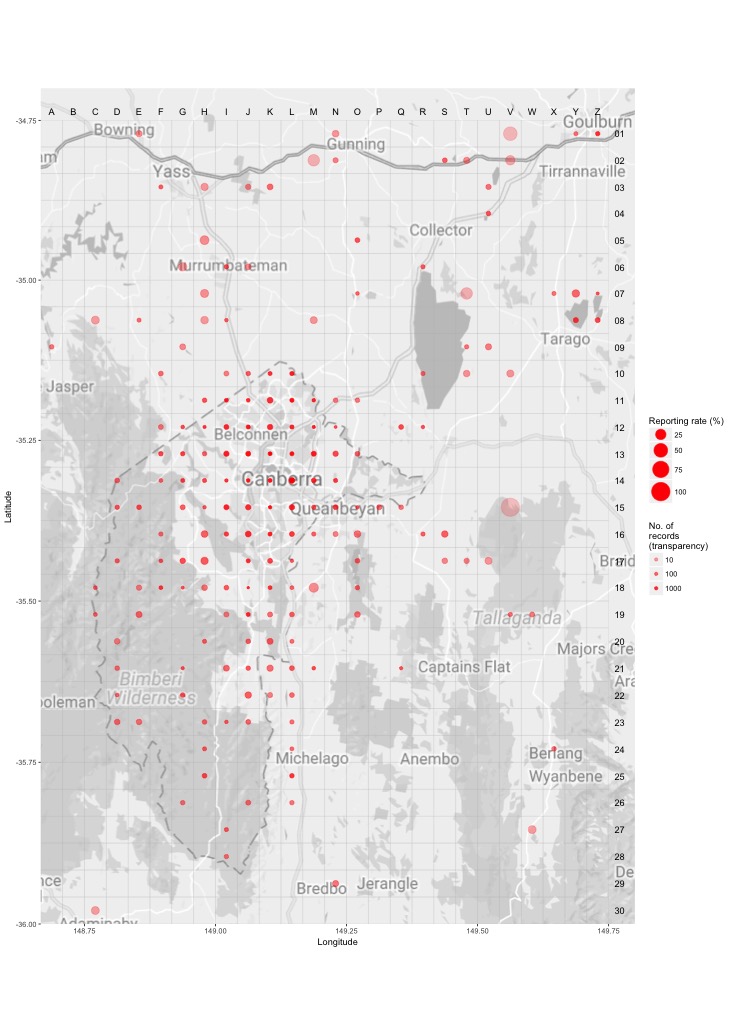
Breeding map
Breeding - 2017
This map shows the breeding distribution of the Australian Hobby for 2017.
The red circles are the grid cells where breeding activity for Australian Hobby have been reported.
The size of the circle represents the number of reports. 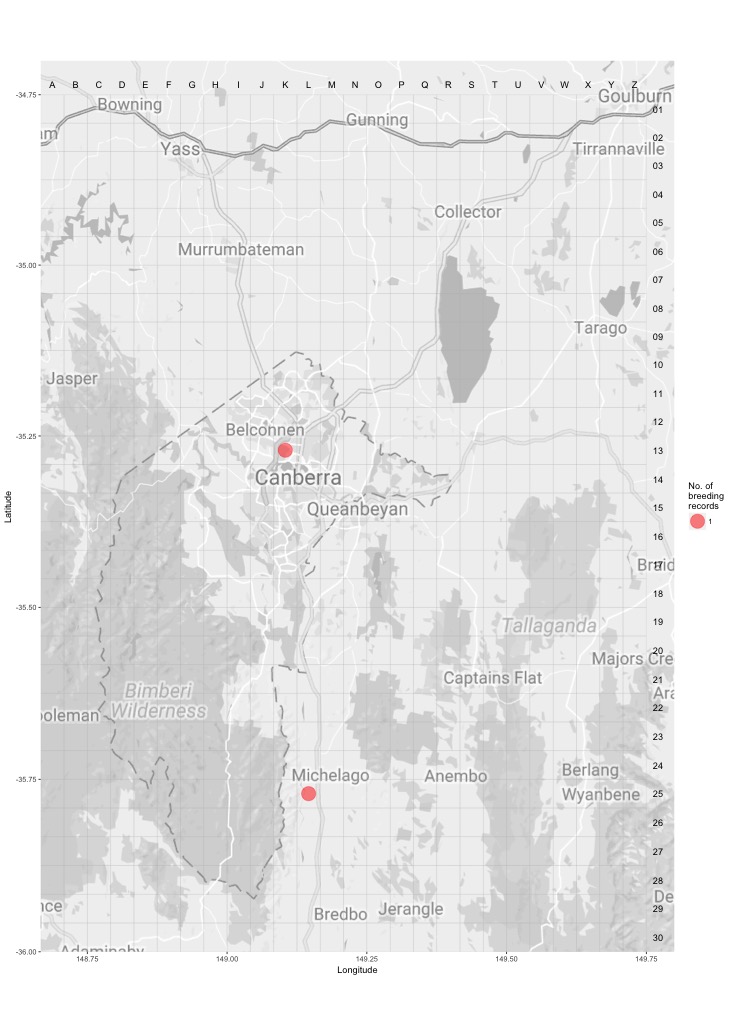
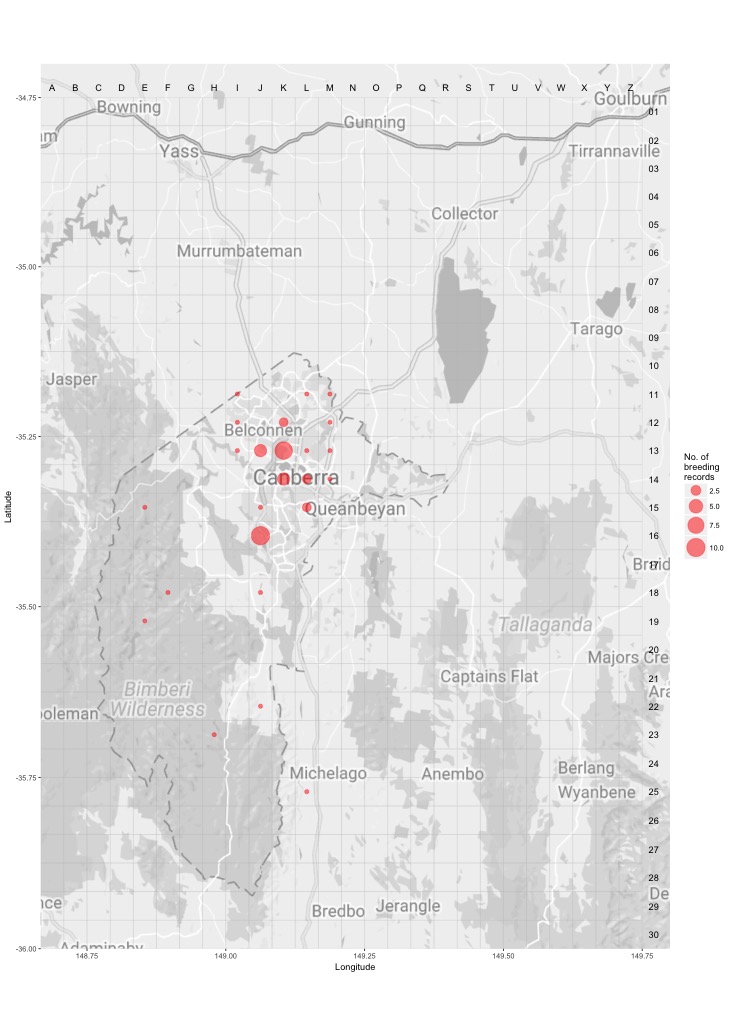
Breeding - all years
This map shows the breeding distribution of the Australian Hobby for all years.
The red circles are the grid cells where breeding activity for Australian Hobby have been reported.
The size of the circle represents the number of reports.